Resize Charts
In this section, users will find three options that allow them to adjust the size of the charts within the dashboard, ensuring a better fit for their visual preferences. These options provide flexibility in customizing the chart layout, enabling users to optimize the display according to the available space and their individual preferences. The available options are as follows:
Maximize
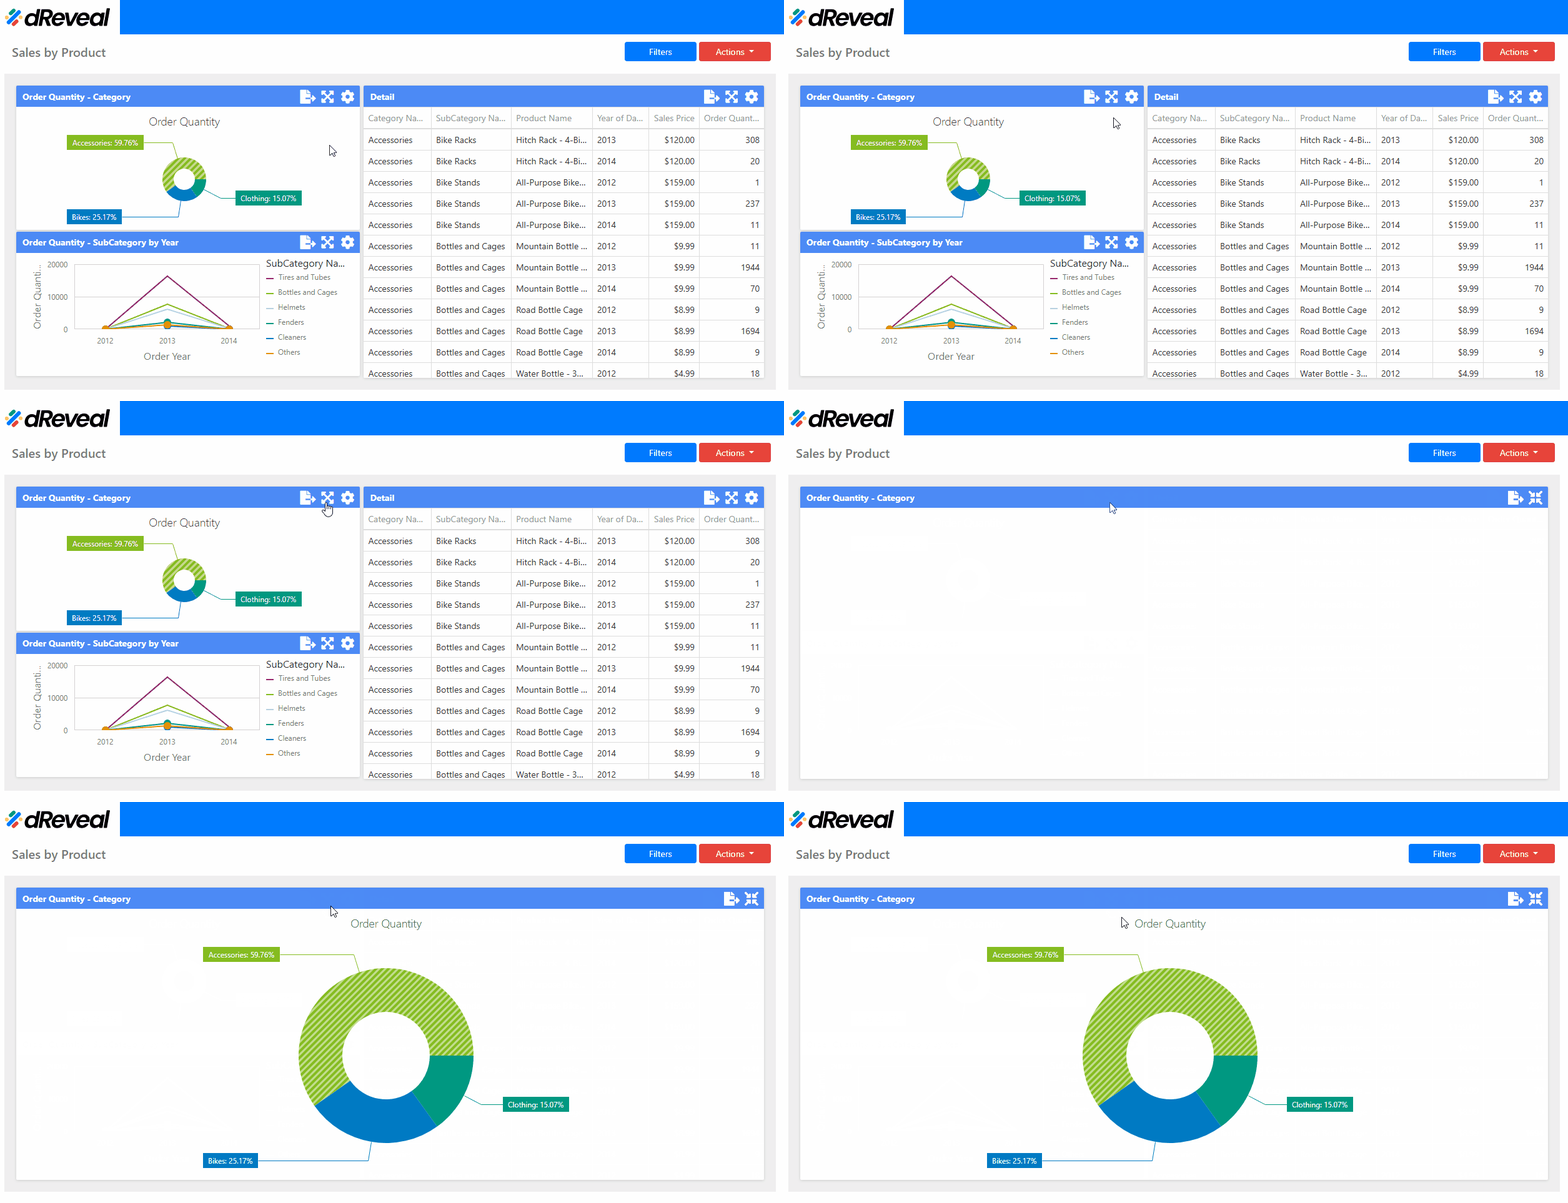
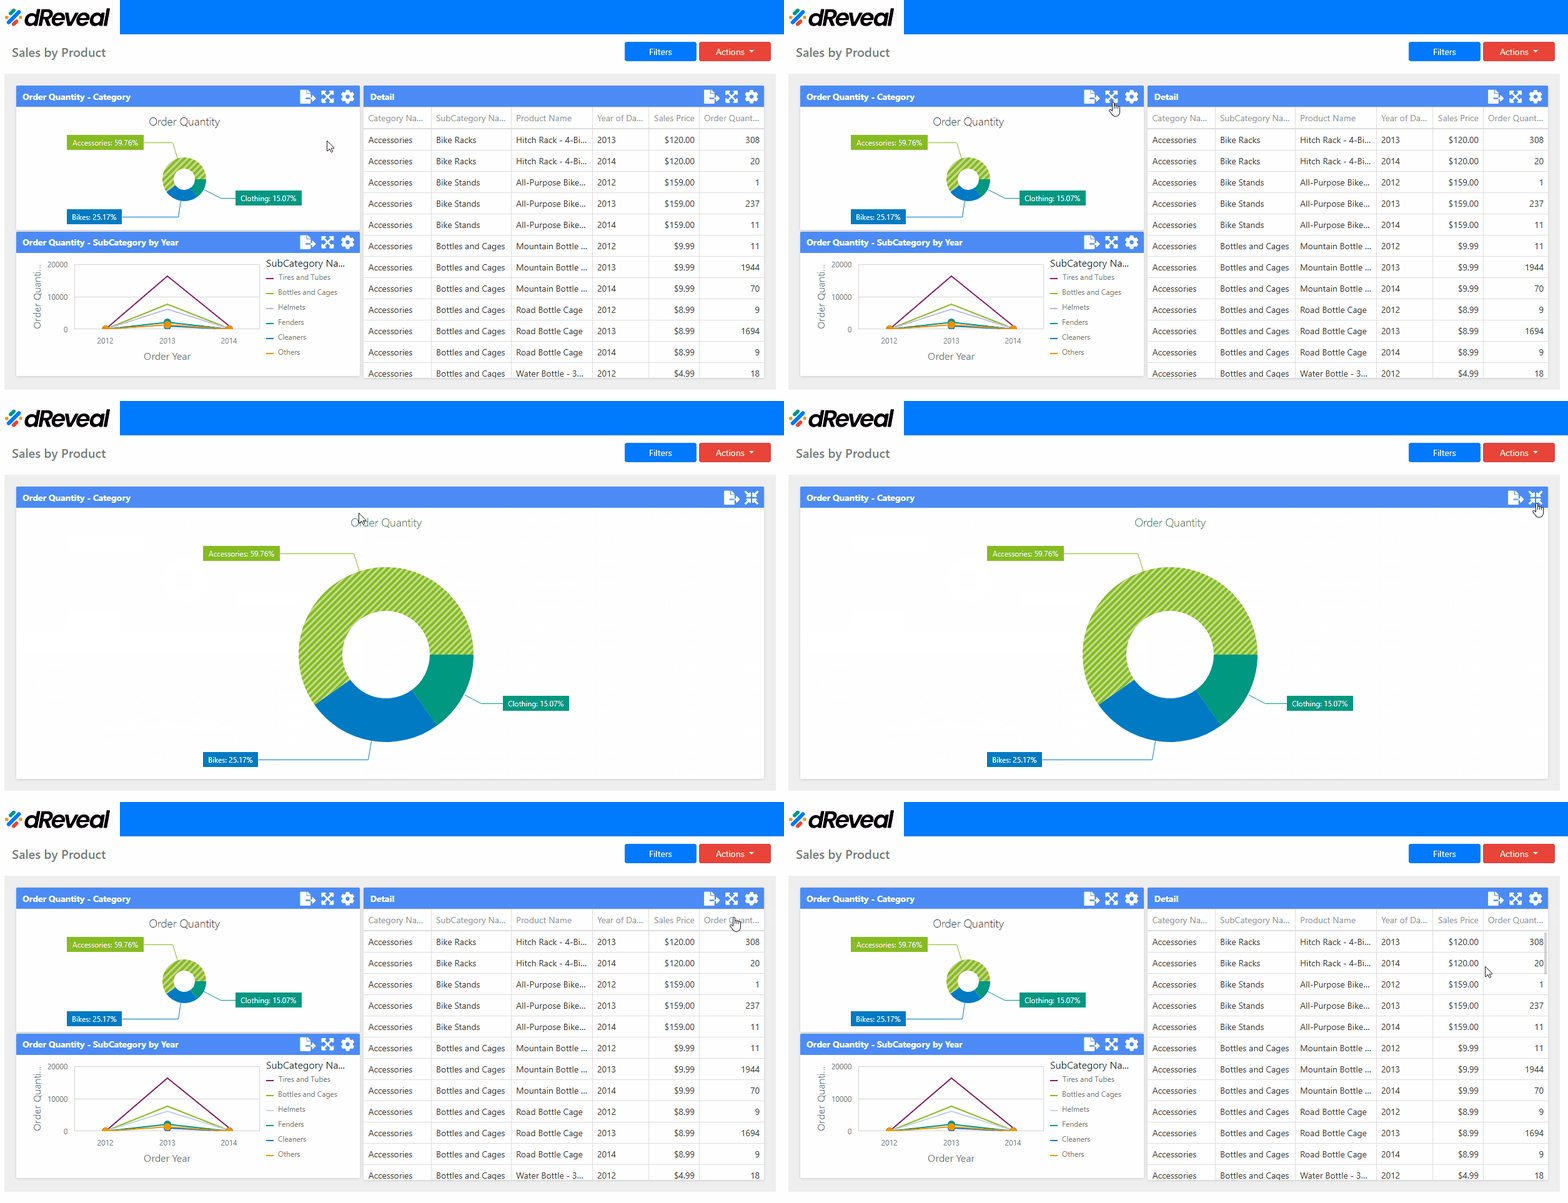
The Maximize functionality allows users to expand a chart to full-screen view, removing any distractions and providing a more detailed visualization. By clicking the maximize option, the chart will occupy the entire available screen area. This is useful when users need to examine the data more clearly or when the chart contains many details that require more visual space.
How to Maximize a Chart
To apply Maximize on a chart, first make sure you have the report you want to execute. Then, open your web browser, either Google Chrome or Microsoft Edge. Next, select the Report and drag it into the browser, dropping it in the browser window. Once the report has loaded, click the Apply button to display the report. Then, click the Maximize option located at the top right of the chart.

Restore
The Restore functionality returns the chart to its original size after being maximized. When a chart is in maximized mode, the restore icon can be used to return it to its default size within the dashboard. This option allows users to toggle between viewing the chart in full-screen mode and seeing it within its original layout in the report or dashboard.
How to Restore a Chart
To apply Restore to a chart, first make sure you have the report you want to execute. Then, open your web browser, either Google Chrome or Microsoft Edge. Next, select the Report and drag it into the browser, dropping it in the browser window. Once the report has loaded, click the Apply button to display the report. Then, maximize the chart, then click the Restore option located at the top right of the chart.

Change Chart Size
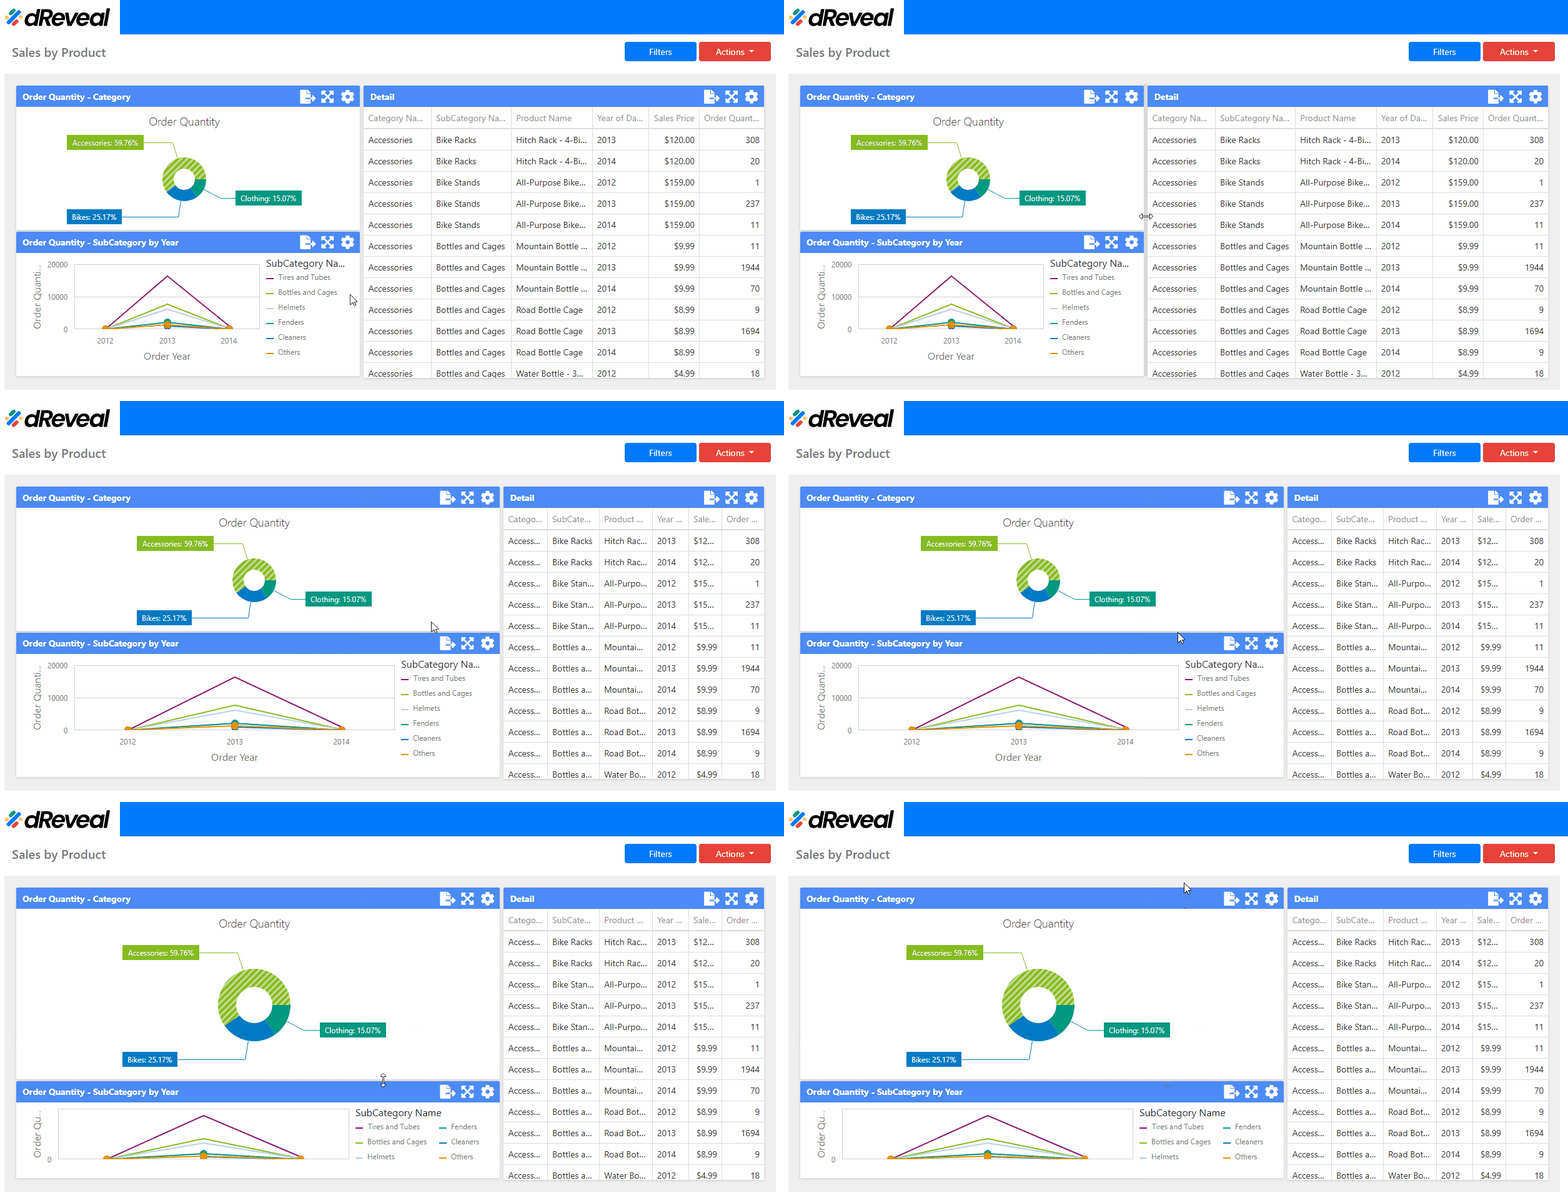
The Change Chart Size functionality allows users to manually adjust the size of the chart within the dashboard. By clicking and dragging the edges of the chart, users can resize it according to their preferences. This is useful when customizing the available space for different visualizations or when a chart needs to be adjusted to better fit the overall layout of the dashboard. Changing the chart size does not affect the data displayed; it only modifies its visualization.
How to Change Chart Size
To resize the charts, first make sure you have the report you want to execute. Then, open your web browser, either Google Chrome or Microsoft Edge. Next, select the Report and drag it into the browser, dropping it in the browser window. Once the report has loaded, click the Apply button to display the report. Then, resize the chart manually by clicking and dragging the chart's edges.

